Predict Trip duration
In this section, I will validate decision tree the model to predict the trip duration.
Decision Tree Regression
The max depth of the tree is chosen with Cross Validation. We also calculate the residual and Cross Validation Score of the prediction.
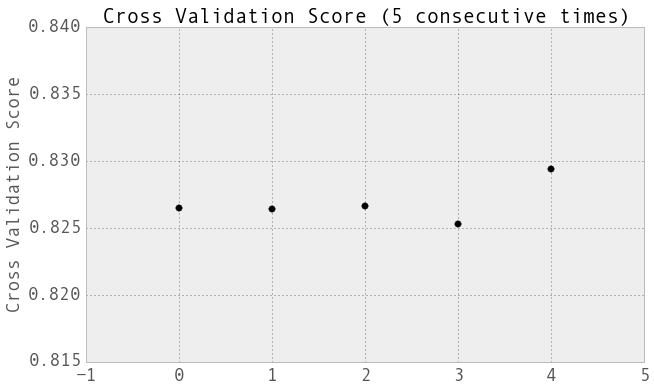
Cross Validation
The following figure shows the plot for 5 consecutive Cross Validation Score for a 5-fold Cross Validation. The mean of the scores is 0.83.
Residual
The residual of the prediction is 3.56 min.
Feature Importances
The feature importances. The higher, the more important the feature. The importance of a feature is computed as the (normalized) total reduction of the criterion brought by that feature. It is also known as the Gini importance
| Categories | Value |
|---|---|
| PickLat | 0.009 |
| PickLng | 0.012 |
| DropLat | 0.019 |
| DropLng | 0.014 |
| Hour of day | 0.057 |
| Day of Week | 0.020 |
| Trip distance | 0.870 |